Log monitor for Datalakes
To analyse or search for errors made during the execution of SLT, we use our own monitor. From a mass transfer ID (the SAP SLT identifier for a configuration), we can analyse each call made, obtaining relevant information such as:
- Payload information (size, content, etc.).
- Responses received by the hyperscaler.
- Processing time from the SAP side.
- Sending time to the hyperscaler.
How to access the log monitor
To gain access to the monitor, please use the transaction code /LNKAWS/SLT_MON
How to operate with it
-
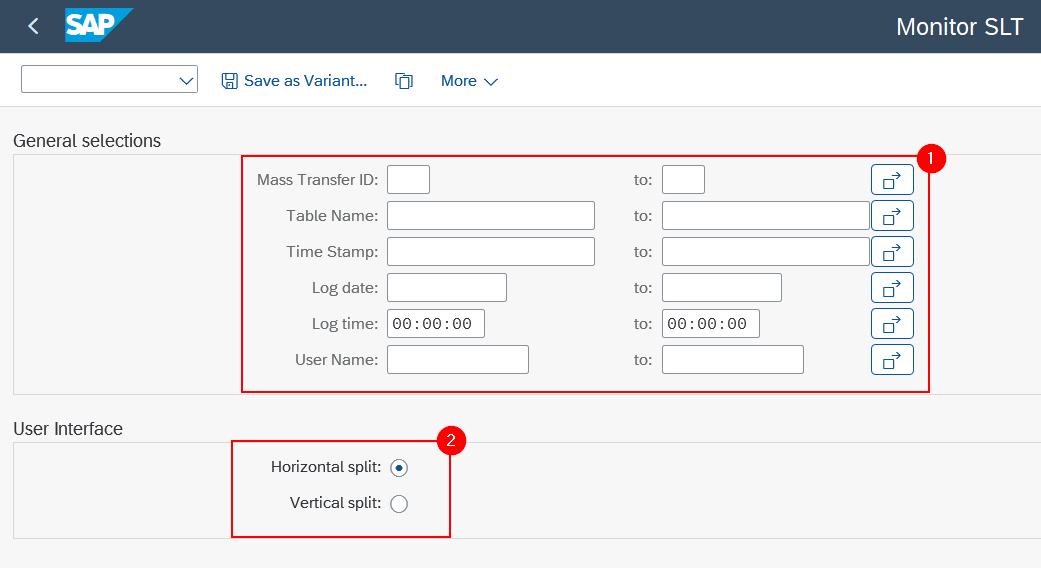
Check the log: When accessing the transaction, a series of fields1 will be made available for the selection of calls to be analysed. The user may choose to make a very specific selection or a more general one, depending on their preferences and the parameters entered. The user interface2 will be selected as horizontal by default; however, this may be toggled on the next screen to suit the user's needs.
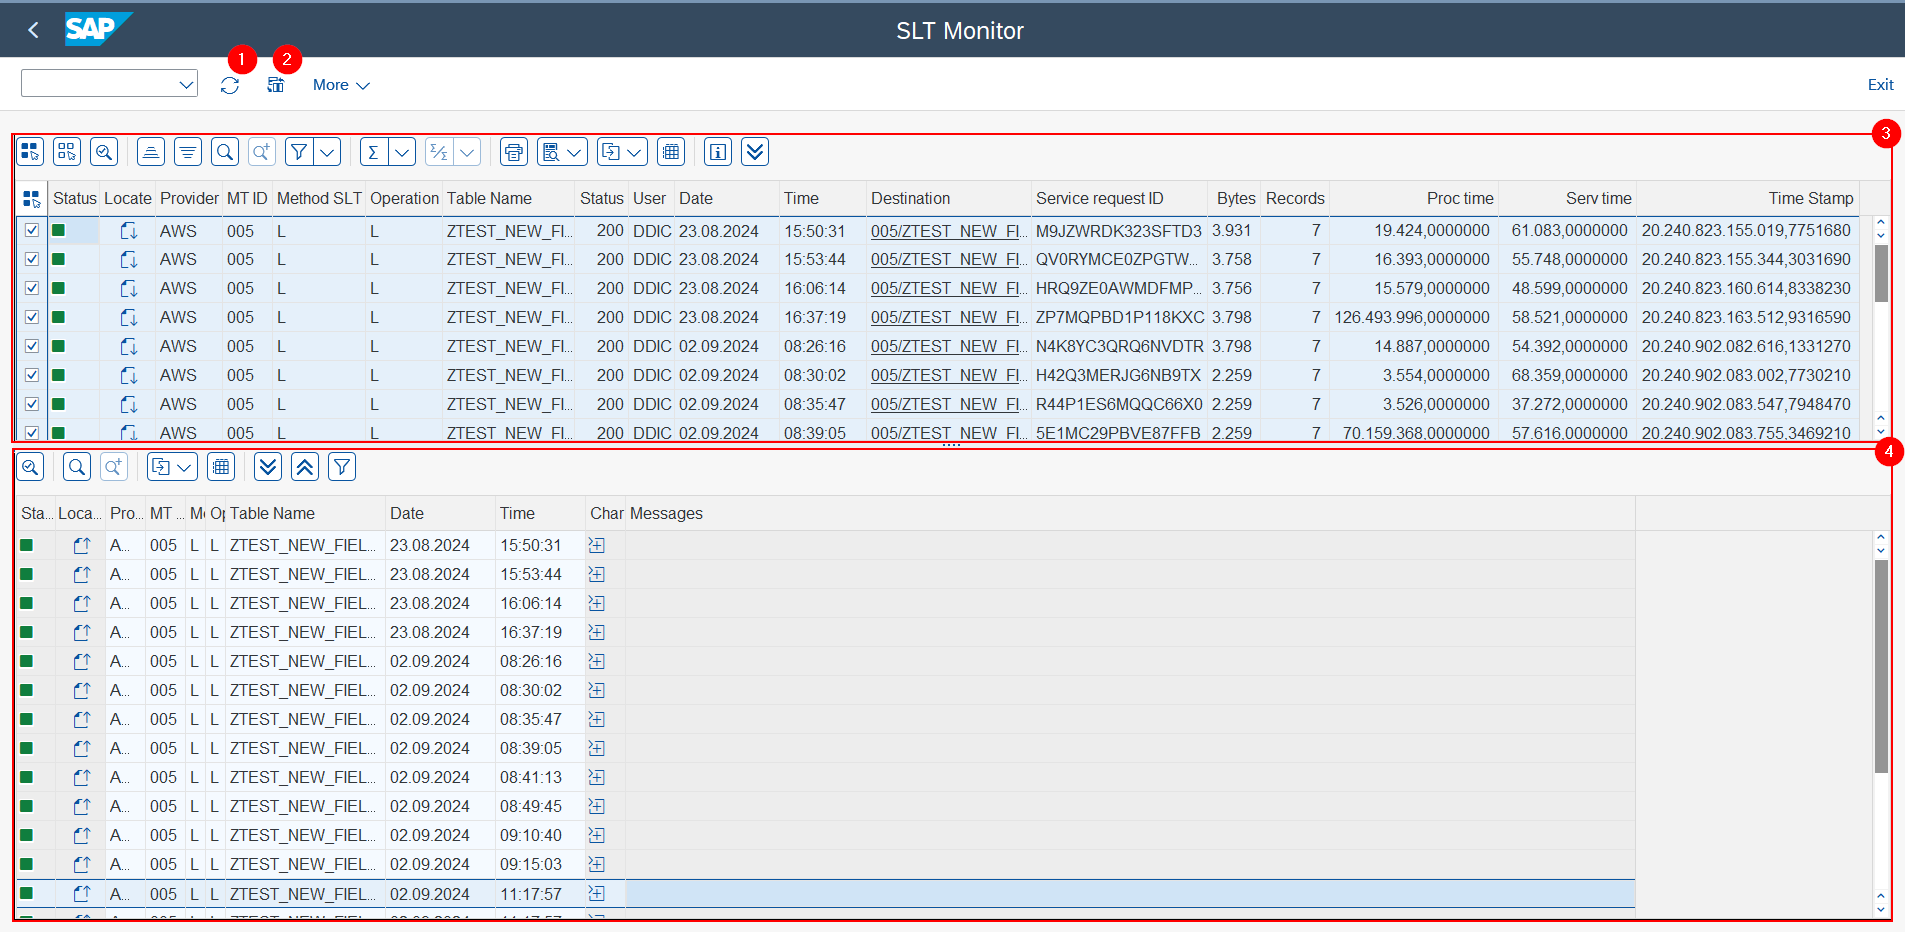
When the report is accessed, the top bar contains two buttons: one to update1 the data based on the search criteria and the next to toggle2 the user interface between horizontal and vertical display of the data. aT screen is displayed comprising two boxes (up and down in landscape mode or left and right in portrait mode).
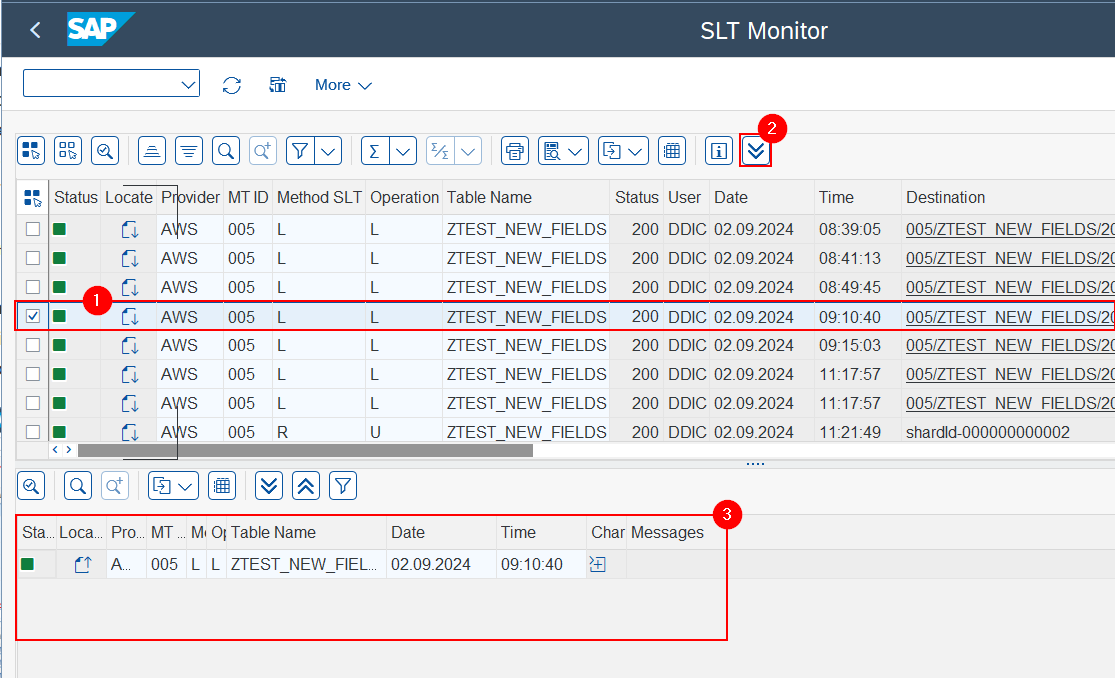
In the first box (Top/Left)3, This data represents each call to a service and provides information about the cloud provider (always AWS) and the type of operation (load, insert, update or delete), the table loaded/replicated, the date, time and user. Furthermore, it provides information regarding the payload, including its size in bytes and the number of records, as well as the result of the operation, indicated by an HTTP code. Additionally, it displays the processing and service call times. In the event of an upload or replication to S3, a link is also provided for downloading the exact content of the delivery (Destination column)..
In the second box (Bottom/Right)4, Find the SLT log detail for each of the calls. To view the details of a specific call, simply click in the last cell on the relevant line in the SLT log. This will filter the ALV details and display the messages associated with that call.
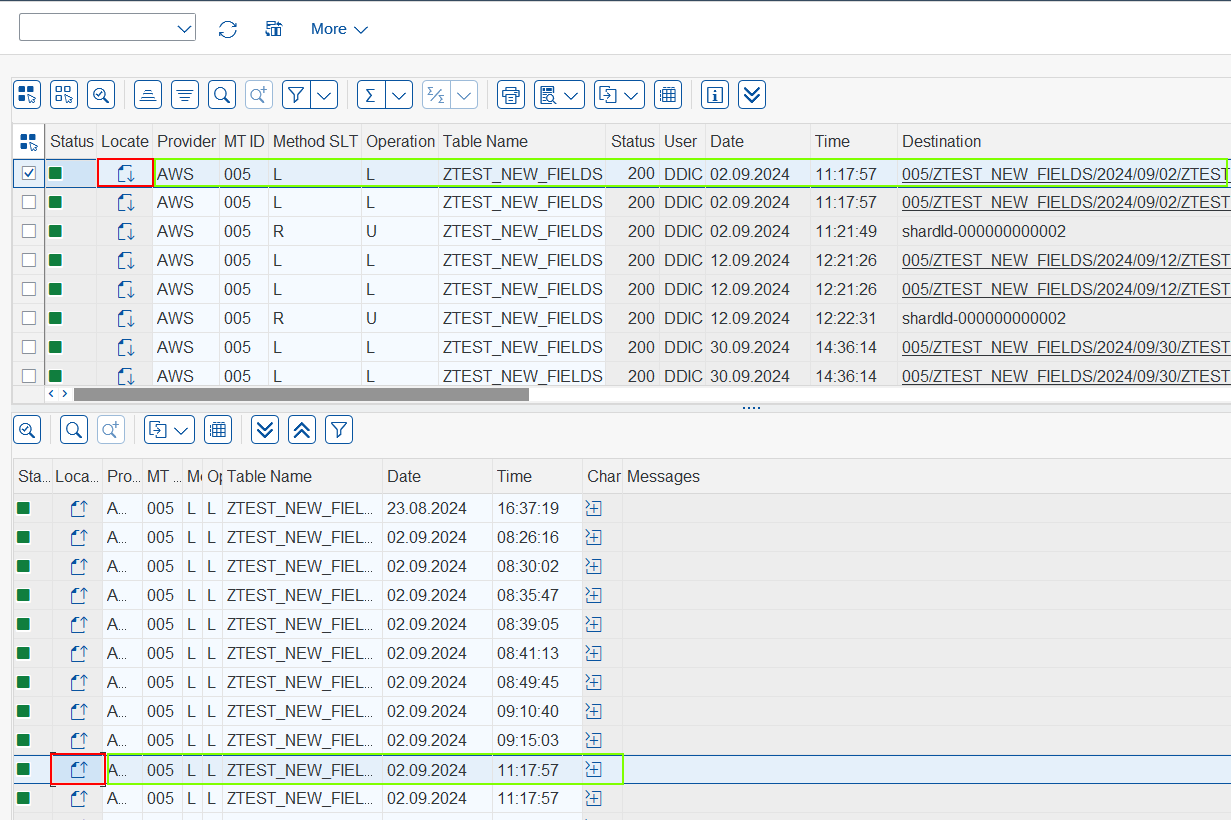
The interrelationship between the data sets can be established through the utilisation of the buttons located within the cells. Upon clicking the button, the report will then proceed to identify the two-line relations within the boxes:
To filter the data, select1 one line in the first box and click on the double arrow button2. This will result in the data in the second box3 being filtered and only the relevant information being shown. A similar action can be performed by double-clicking on the line.
-
Download/Display payloads:
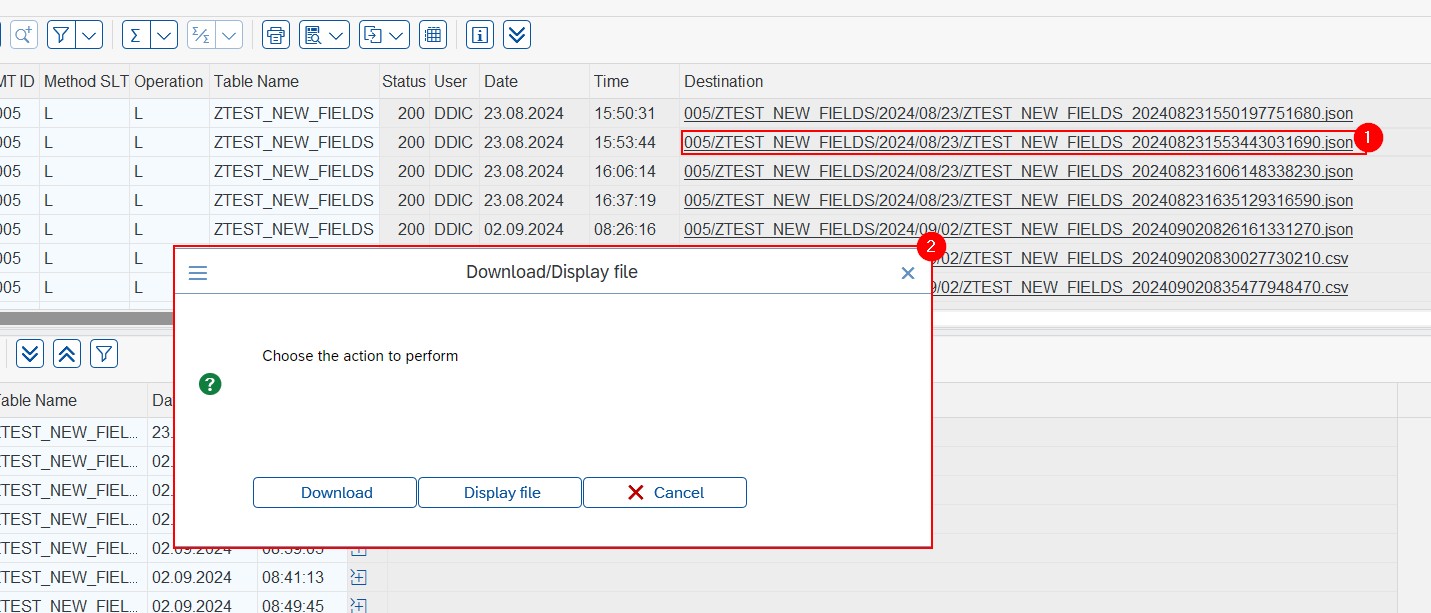
The files listed in the destination column of the first box can be viewed or downloaded for further analysis. Should you wish to do so, simply click1 on the file and a message will open a popup2 allowing you to select the option you require. The same action can be performed by clicking with the right button and selecting the Display/Download option.IMPORTANTPlease note that the information displayed or downloaded corresponds to the current file and not to a version at the time of the execution of the process.
To illustrate, if today is 4 October 2024 and I am displaying an upload from 4 September 2024, the displayed or downloaded file will correspond to the current date (4 October 2024) and not to 4 September 2024.
Similarly, if a file has been deleted after execution, it will not be displayed or downloaded, as it no longer exists.
-
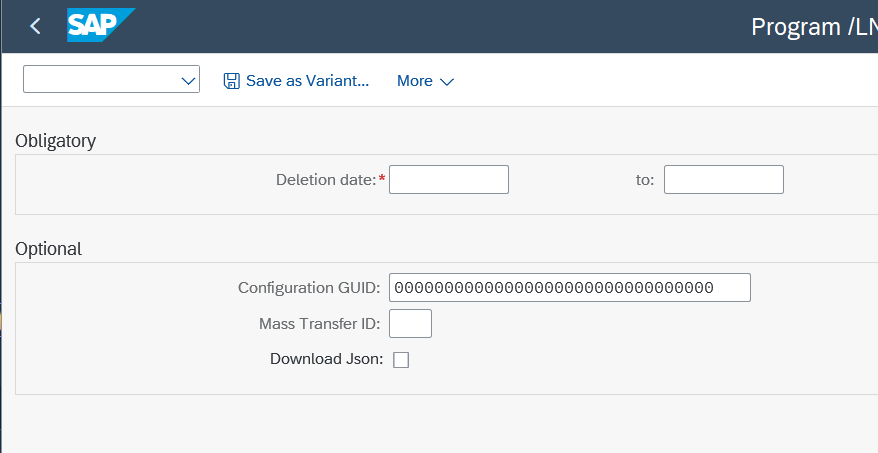
Delete old data: The log is continuously active, with solutions saving pertinent information in a database table for future reference by log consultants. A report is available for deleting this data: /LNKAWS/SLT_DELETE_LOGS. It can be executed directly, but it is recommended to create a job for periodic execution and deletion of old data.
