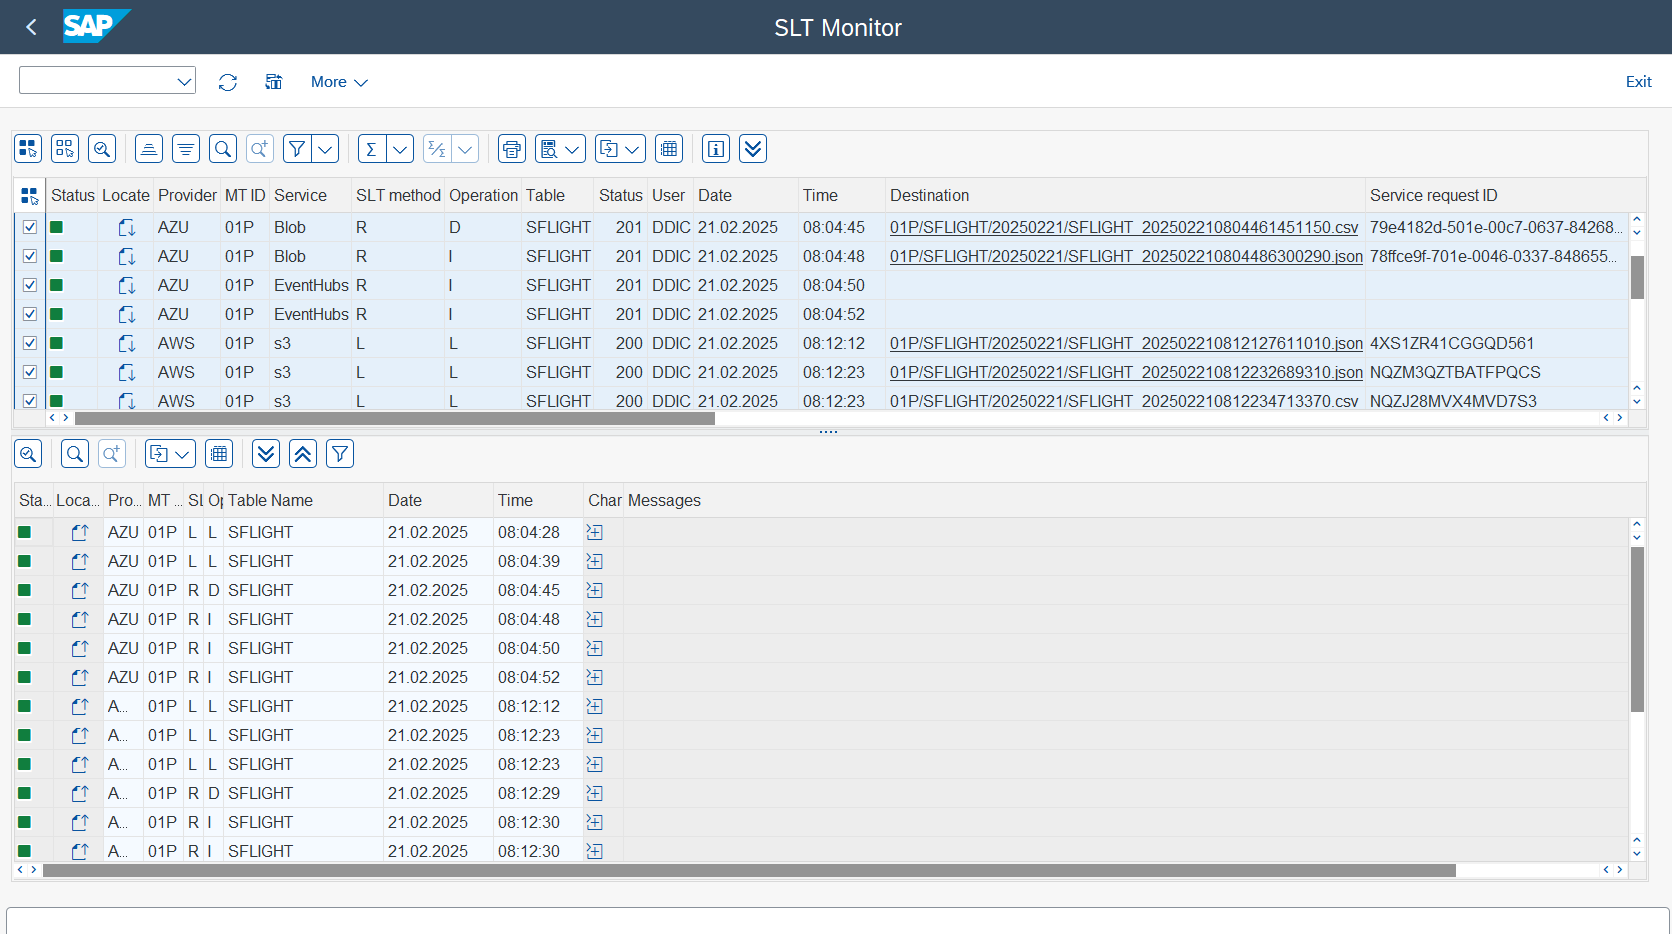
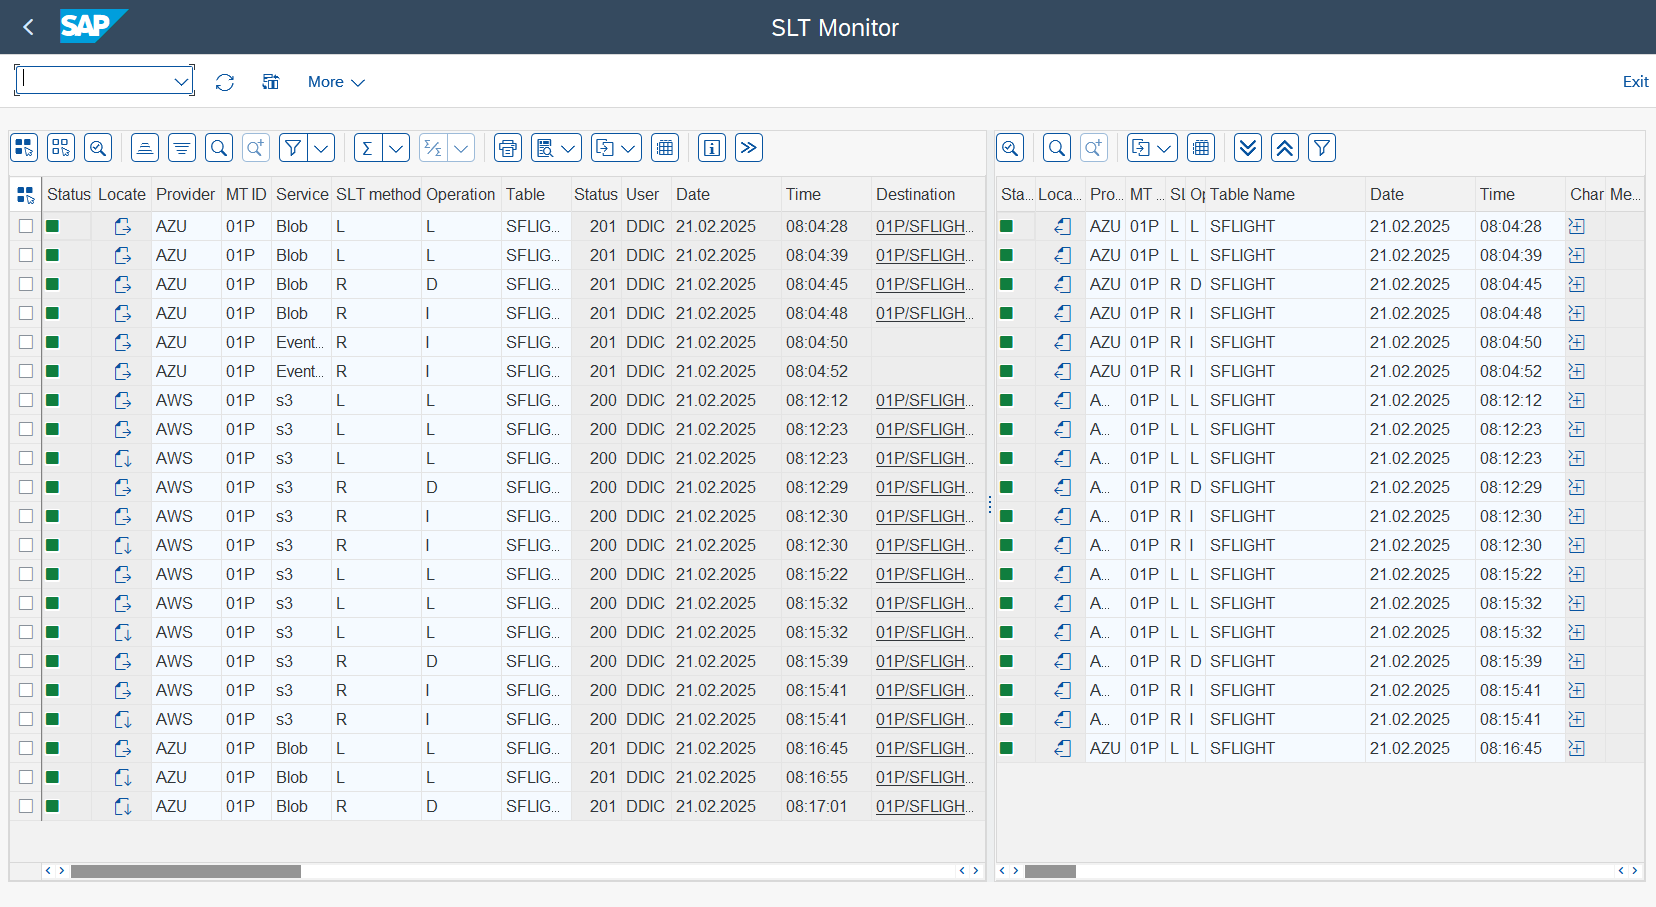
Logs
In this section, you will discover how to access the execution logs for a process. There are two methods available for doing so.
Execution logs
Once this relation is created, SAP will be able to configure all Business Documents, Archive Sessions and Attachments storage destination specifying one of the content repositories.
- Go to transaction /n/LNKAWS/SLT_LTR.
- In the CxLink Data Lakes Configuration - Overview screen, select one Mass Transfer ID or Schema Name from the list.
- Go to the
Execution logstab. - When you go into the tap, it is observed that the screens are devoid of any content:
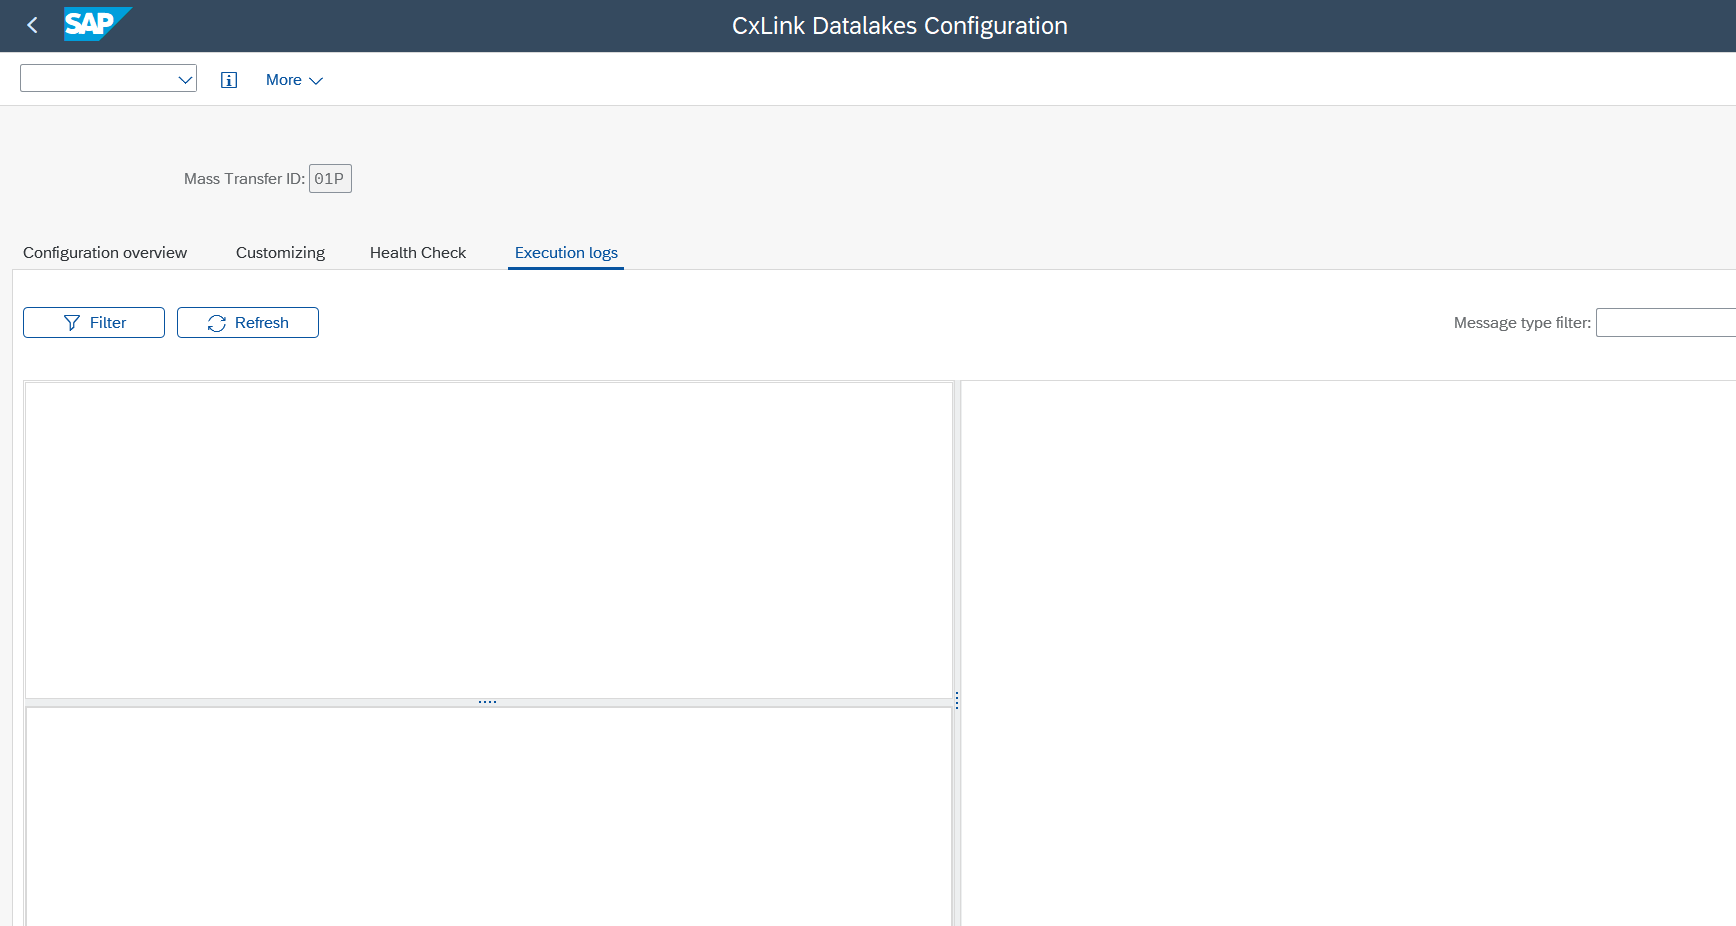
- In order to access the execution log for a process, please enter the
Filterbutton and apply it. (Please note that the minimum date range must be defined.)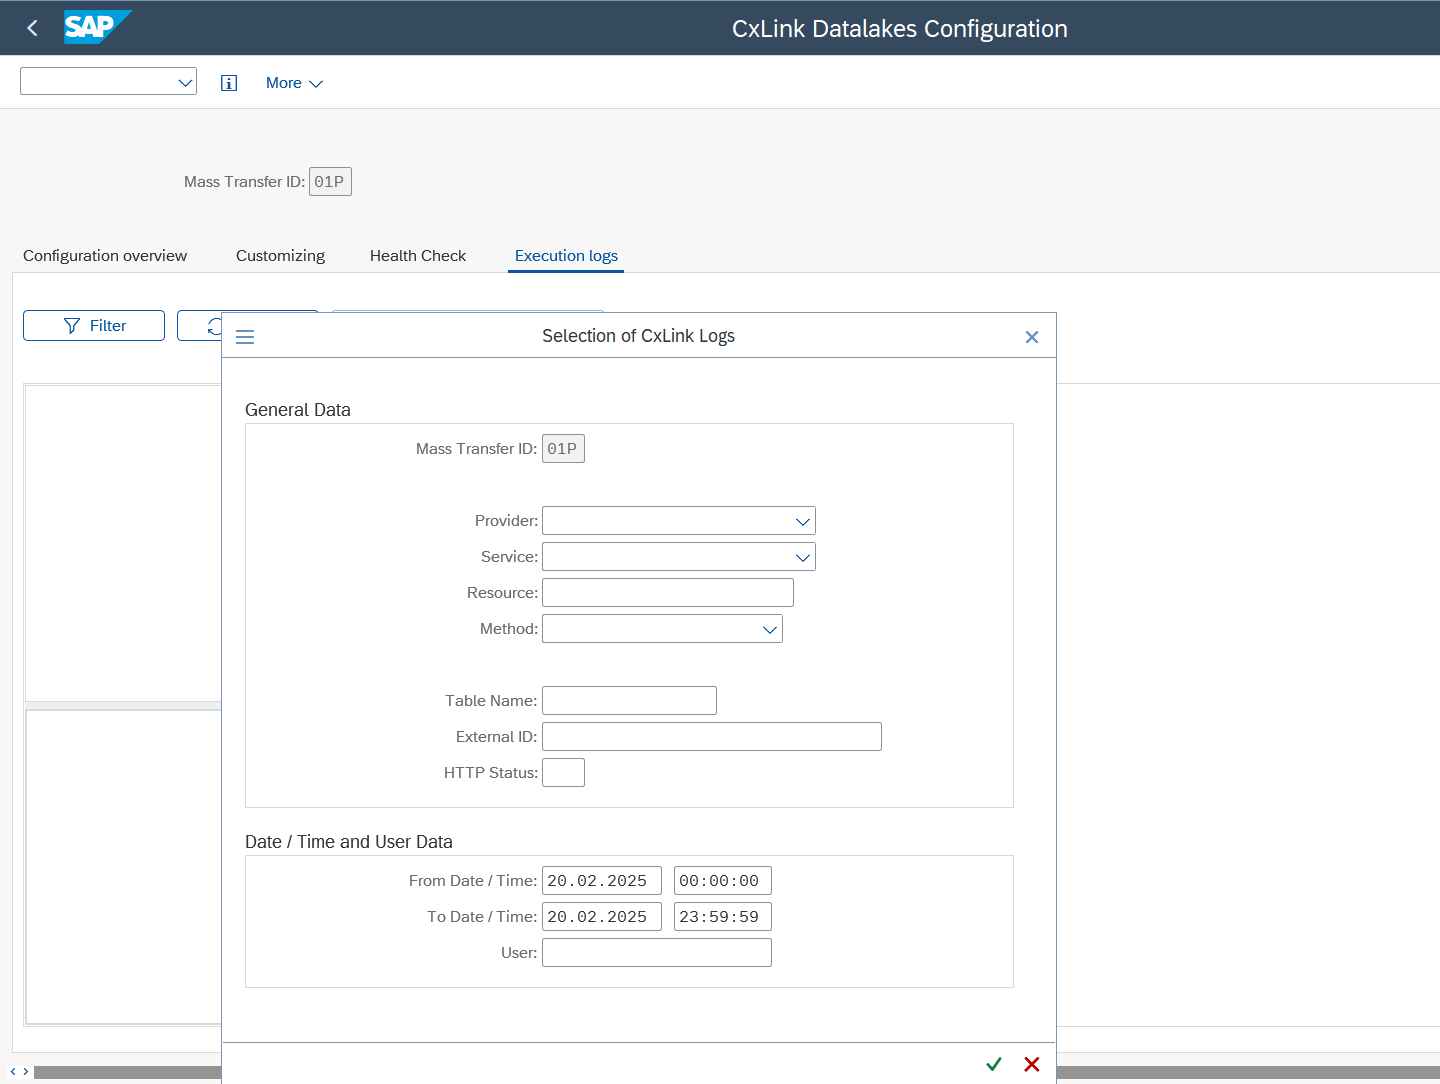
- Once the filter has been applied, you will be able to see all the relevant executions. If you double-click on one of these, the messages and the relevant information will be displayed.
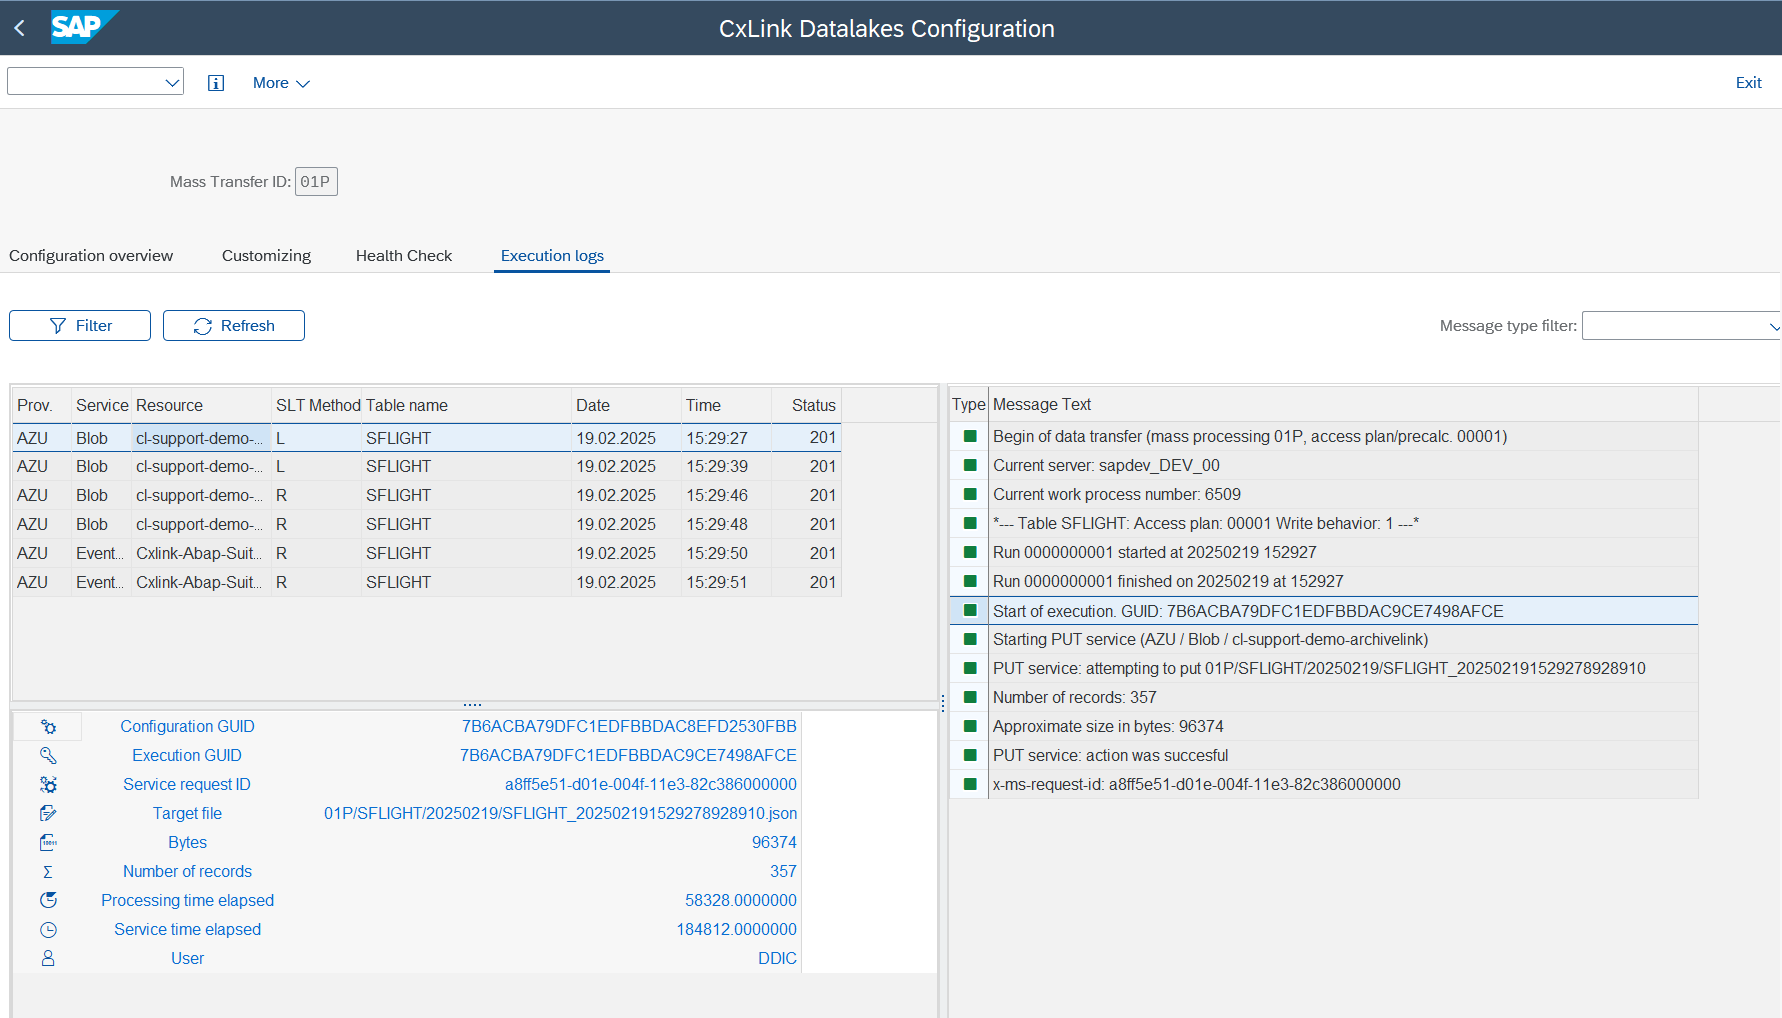
Log Monitor
The monitor is another report that you can use to check one or multiple mass transfer ID processes.
-
Go to transaction /n/LNKAWS/SLT_MON.
-
Please define the parameters and select the view* horizontal or vertical.
*(These option can be changed at a later stage).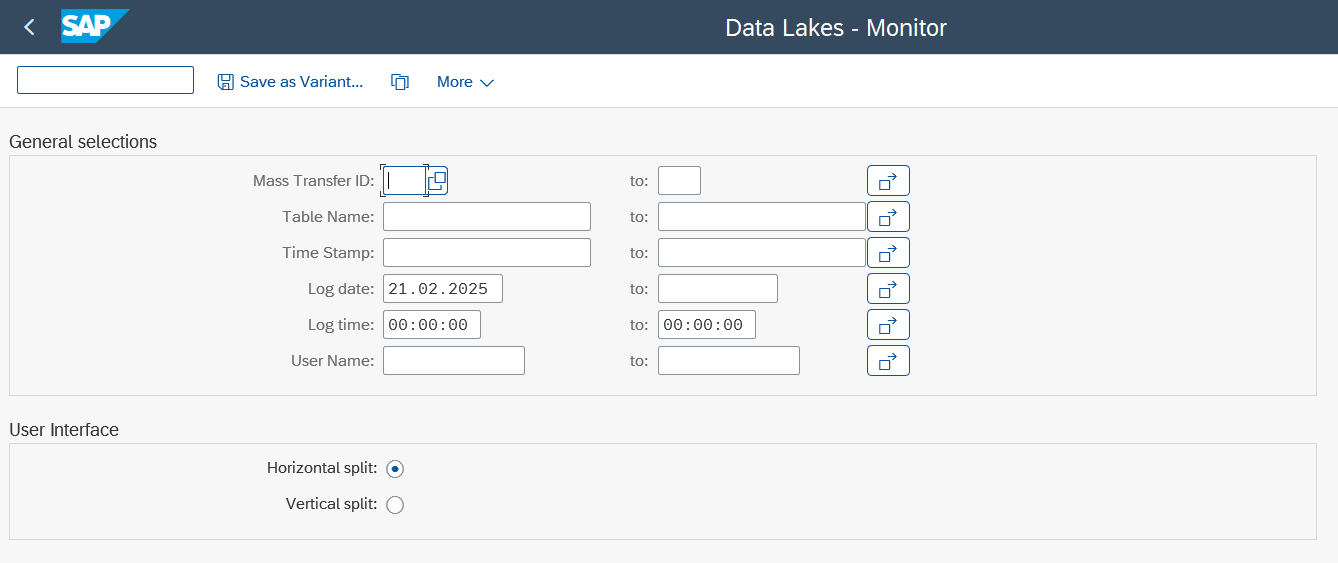
-
Once the process has been executed, the log information will be displayed in the designated boxes.

Features
-
To apply a filter, simply double-click on a line. Alternatively, you can select a row and use the
>>orvin toolbar.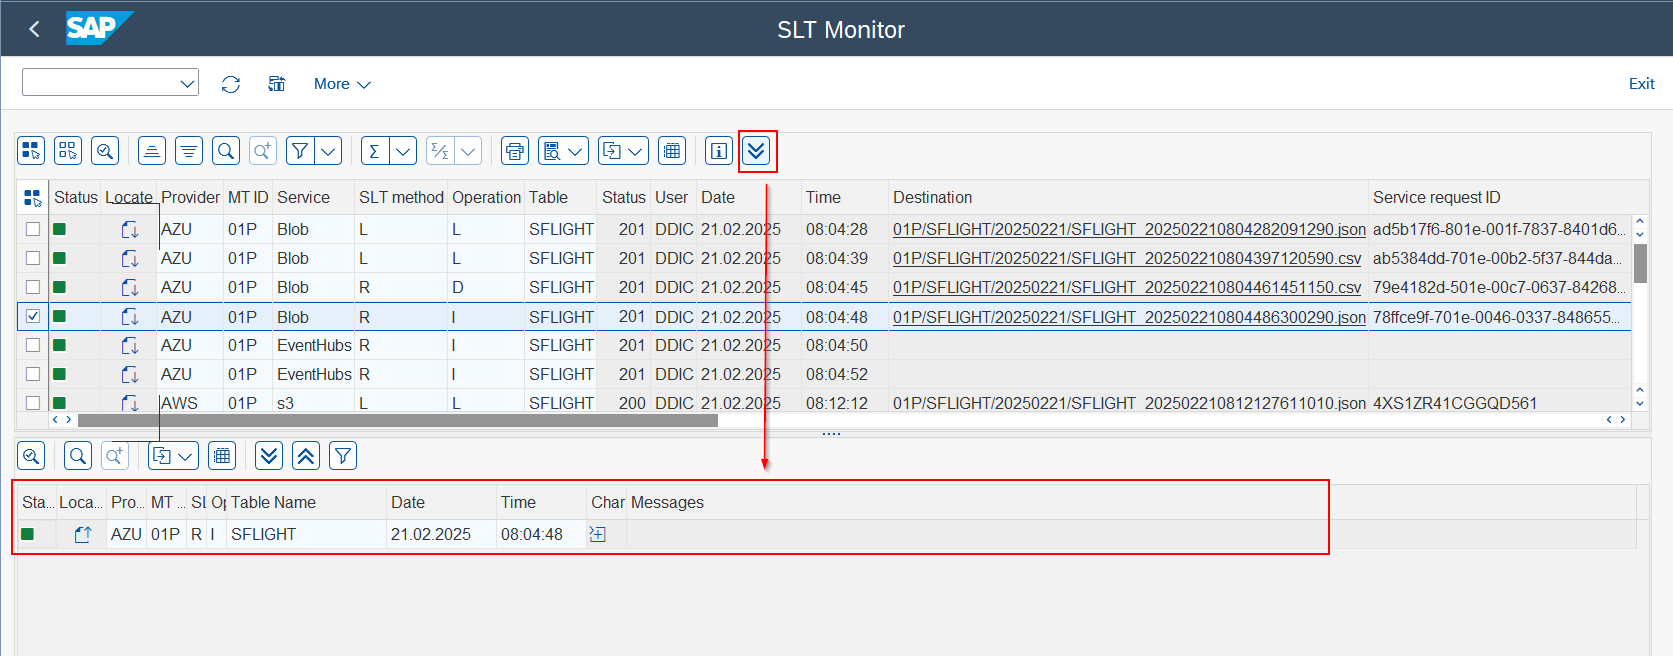
-
To locate the relationship of a record between the two frames use the
Locaterow button to filter the data. When clicked, both lines in the boxes will be selected.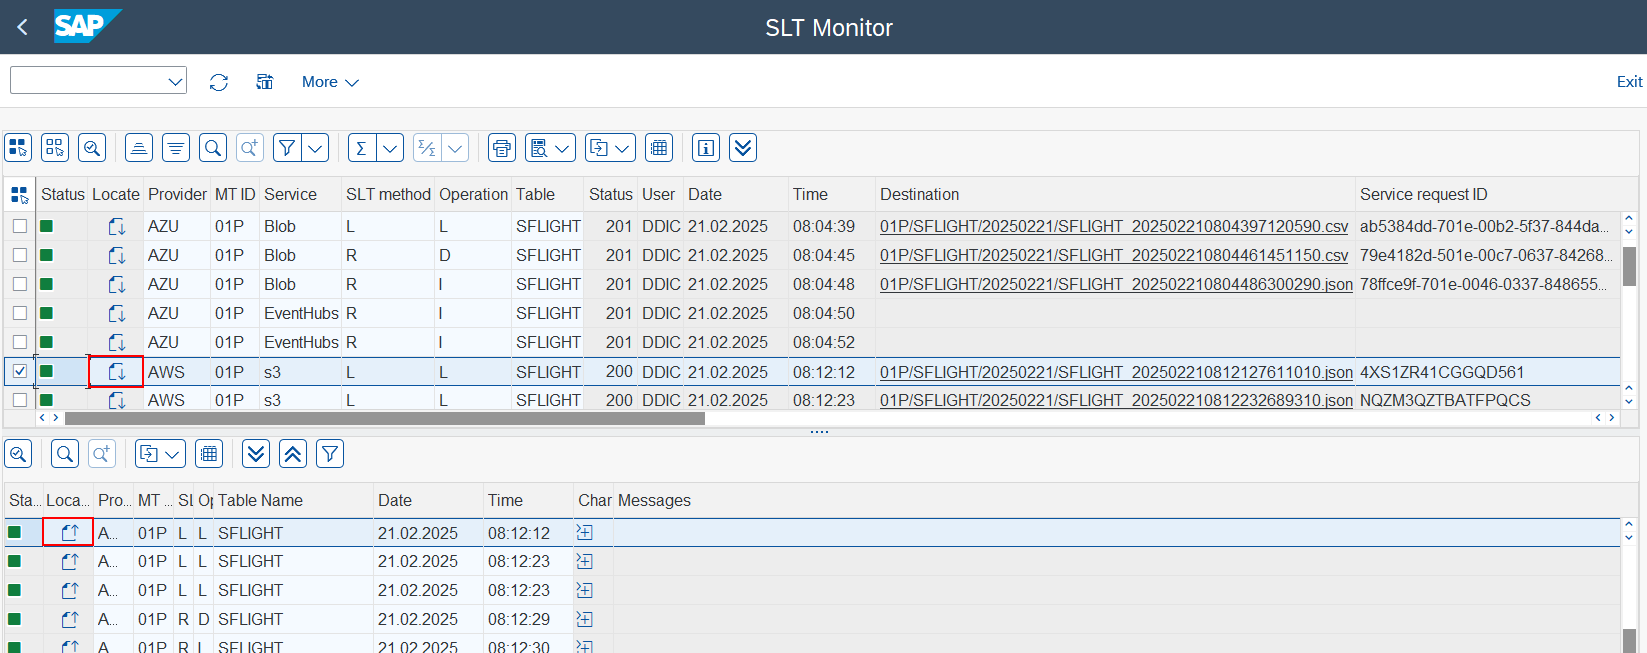
-
If you click on the
Charrow button, you will be able to read the message log.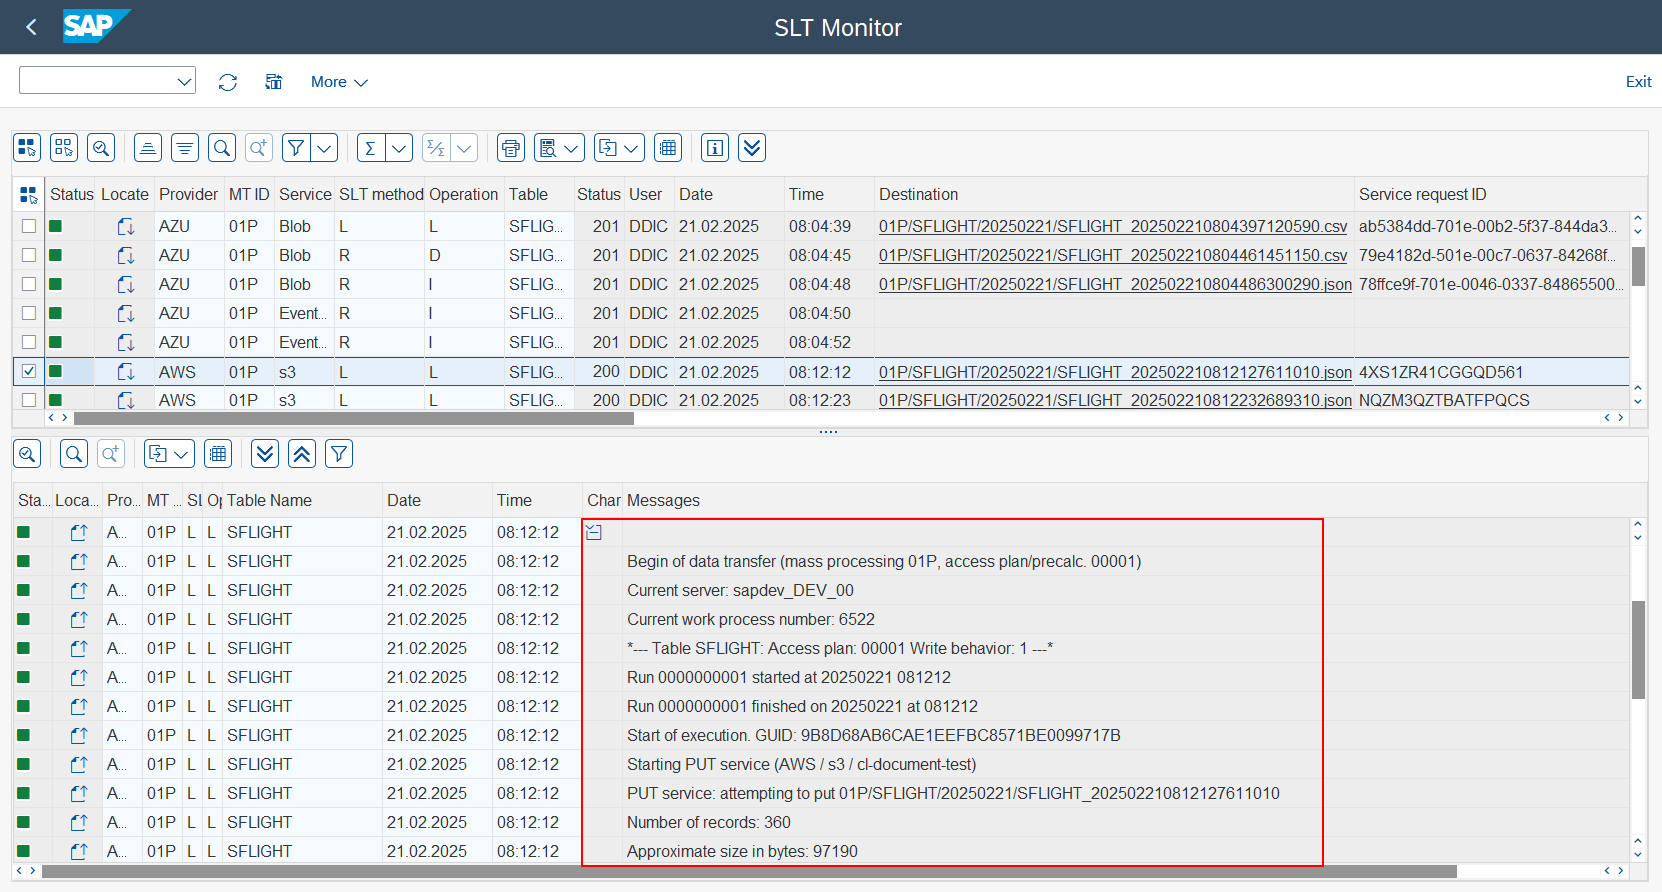
Additionally, you have the option to expand or collapse all the messages using the buttons provided in the toolbar
^orv.- Expand all
- Collapse all


-
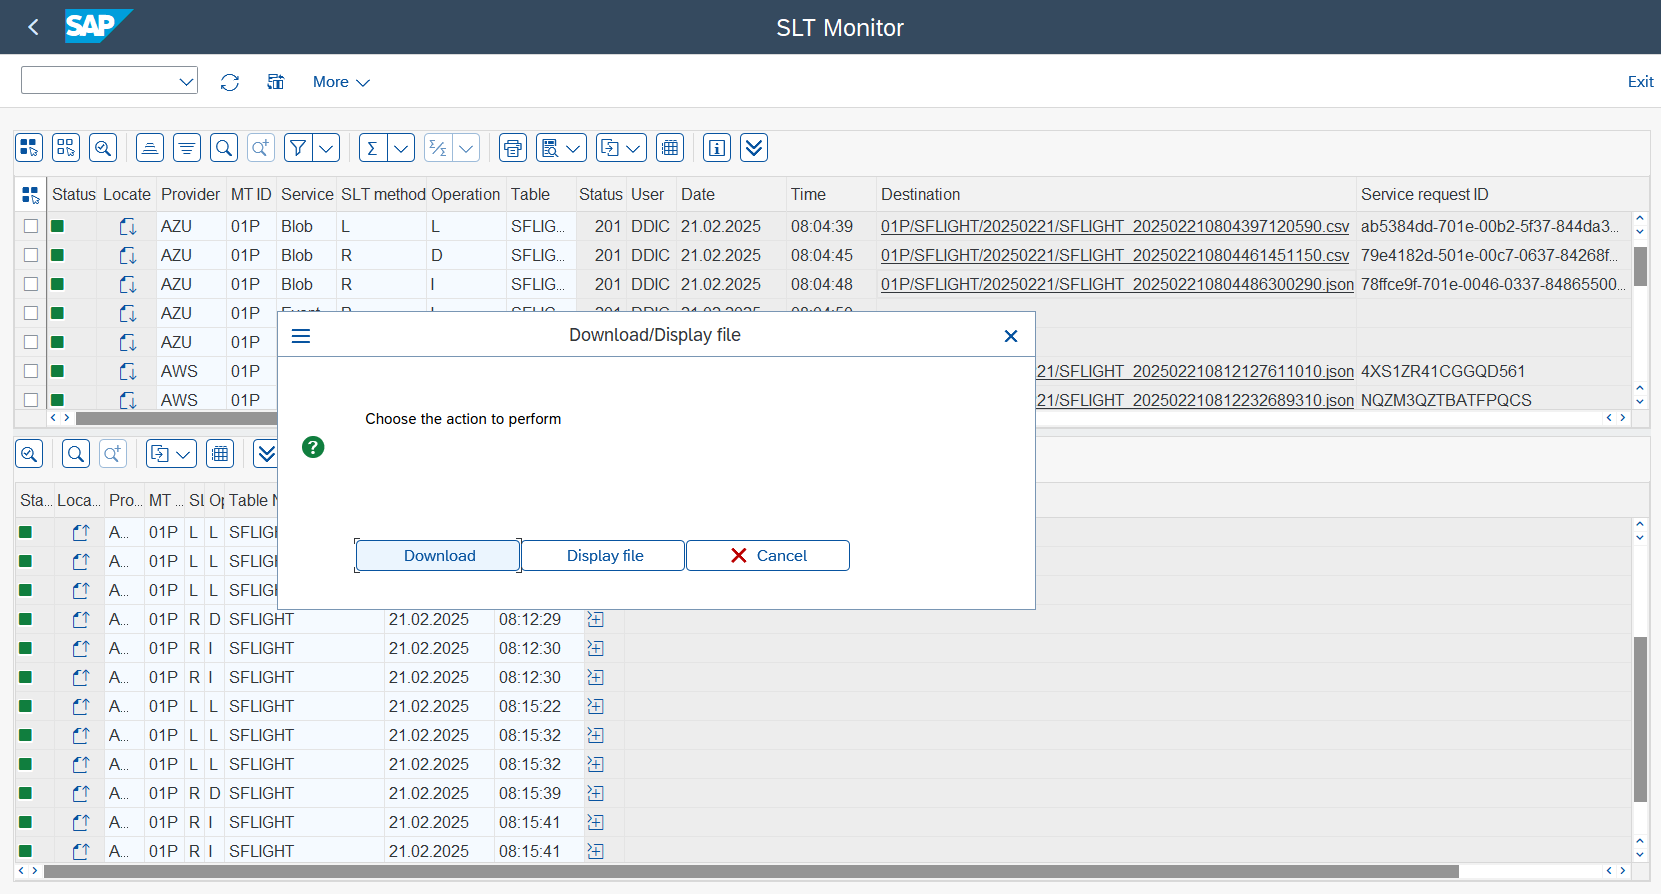
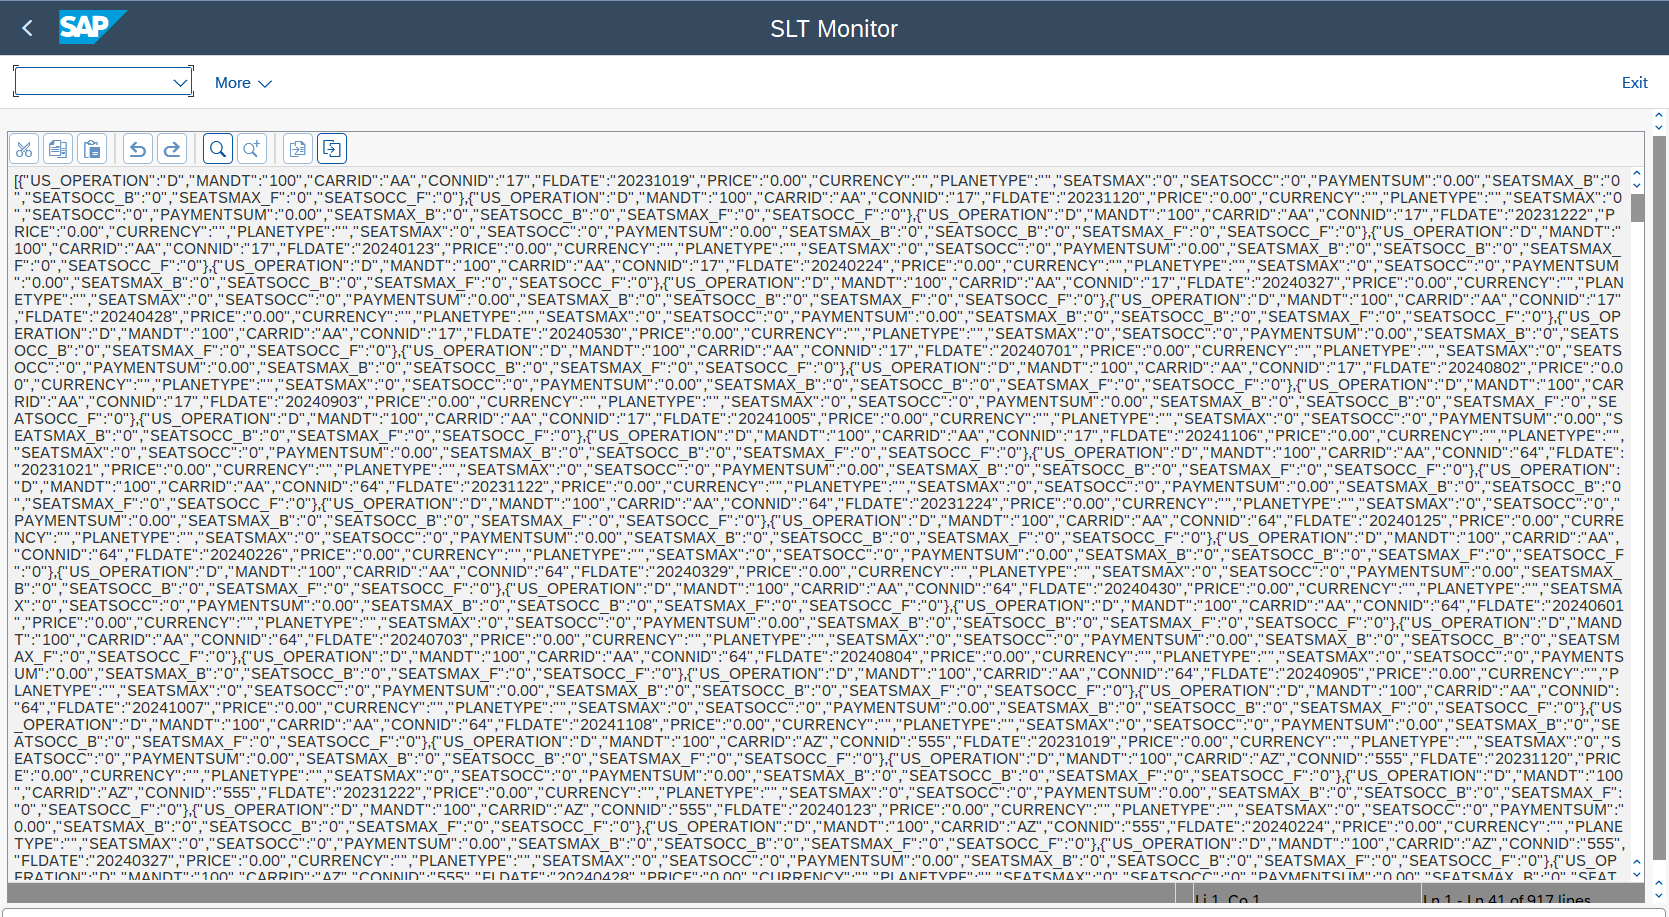
You can download or display a send file. To do so, simply click on the Destination field and choose the relevant option from the pop-up menu. It should be noted that the ability to show or download uploaded content is exclusive to AWS S3 and Azure Blob services.
 Display file:
-
To change the view, please use the icon located in the toolbar.
- Horizontal View
- Vertical View
